Fig. 7
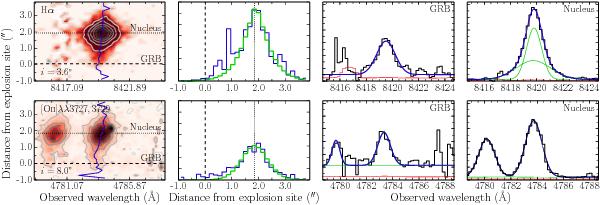
Parts of the rectified and wavelength-calibrated 2D X-shooter spectrum (PA = 41°) obtained 0.72 days after the explosion (Table 1). The first column shows the 2D profile of Hα and the [O ii] doublet. The blue lines trace the position of maximum flux. The inclination angles i (defined as the angle between the major axis and a vertical line) are displayed in the lower left corner. Contour lines are overlaid to guide the eye. The cross-dispersion profiles (shown in blue) are displayed in the second column. The coding of the vertical lines is identical to that in the first column. For illustration purposes, we fitted the profiles with a Sérsic function (displayed in green), where the wings left of the centres of lines were excluded from the fit. The line profiles in dispersion direction are shown in the last two columns. The green line is the fit of individual components and the blue line of the compound. At z = 0.283, an angular distance of 1′′ translates into a projected distance of 4.3 kpc. The error spectra in the third and fourth columns are overlaid in red.
Current usage metrics show cumulative count of Article Views (full-text article views including HTML views, PDF and ePub downloads, according to the available data) and Abstracts Views on Vision4Press platform.
Data correspond to usage on the plateform after 2015. The current usage metrics is available 48-96 hours after online publication and is updated daily on week days.
Initial download of the metrics may take a while.