Fig. 2
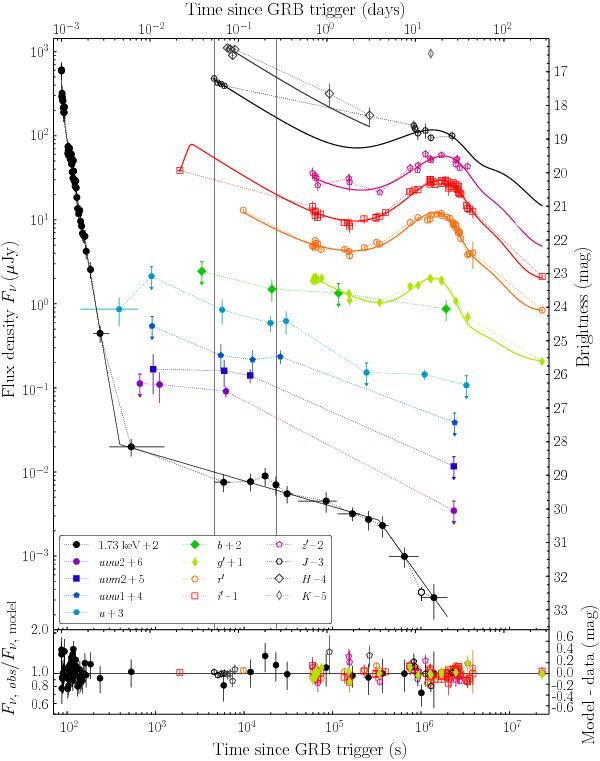
X-ray, optical and NIR light curves of the transient that followed GRB 120422A. Arrows indicate 3σ upper limits. The UVOT v-band upper limits are very shallow and not displayed. Data in the g′r′i′z′J bands were modelled with a rescaled SN 1998bw template at z = 0.283, which was superposed on a power-law (where the slope was identical in all bands) using the formalism in Zeh et al. (2004). The best-fit model parameters are shown in Table 3. Model light curves in bluer or redder filters are not shown, since they would require extrapolation of the spectral range of the SN1998bw template. Fit residuals are displayed in the bottom panel. The XMM-Newton observation was carried out at 980 ks (open dot). The shifts (in magnitude) of the different bands are given in the legend. To convert the X-ray light curve to flux density, we assumed a spectral slope of β = 0.9 and no spectral evolution (for details on the SED modelling see Sect. 3.2.3). Both assumptions have no implications on our analysis. The XMM-Newton data point was discarded from the light curve fit because of uncertainties in the cross-calibration between Swift/XRT and XMM-Newton. The vertical lines indicate the epochs of the X-ray-to-NIR SEDs presented in Sect. 3.2.3. Error bars can in some cases be smaller than the marker size.
Current usage metrics show cumulative count of Article Views (full-text article views including HTML views, PDF and ePub downloads, according to the available data) and Abstracts Views on Vision4Press platform.
Data correspond to usage on the plateform after 2015. The current usage metrics is available 48-96 hours after online publication and is updated daily on week days.
Initial download of the metrics may take a while.