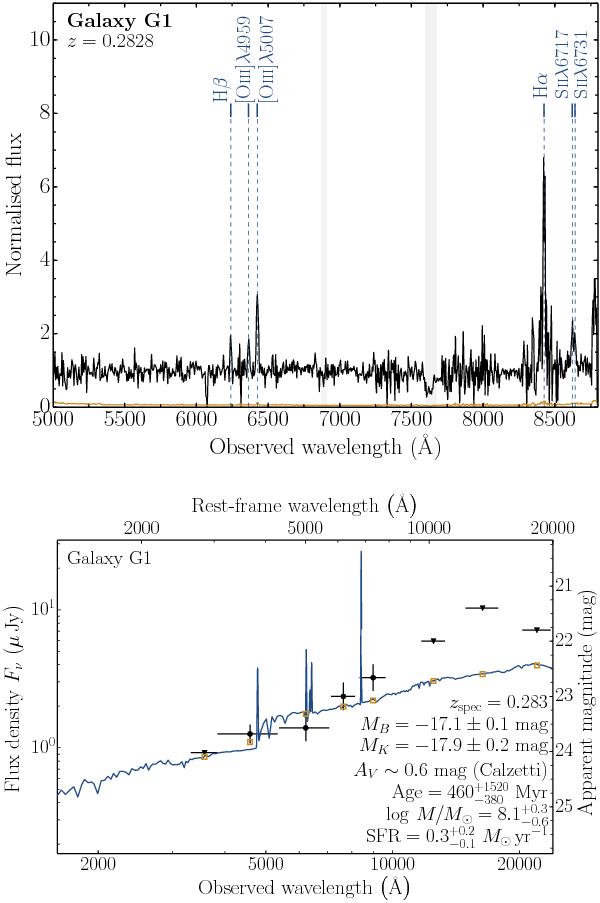
Fig. D.1

Top: normalised spectrum of galaxy G1 (Fig. 9; Table 6) obtained with GTC/OSIRIS 3.6 days after the GRB. Several emission lines are detected at z = 0.2828. Hα is partly blended with a sky emission line. The error spectrum is shown in orange. The positions of telluric bands are highlighted by grey-shaded areas. Bottom: spectral energy distribution from 1600 to 24 000 Å (similar to Fig. 8). The solid line displays the best-fit model obtained with Le Phare (χ2 = 3.1, number of filters = 4). The beige open squares represent the model predicted magnitudes. Upper limits are displayed as triangles.
Current usage metrics show cumulative count of Article Views (full-text article views including HTML views, PDF and ePub downloads, according to the available data) and Abstracts Views on Vision4Press platform.
Data correspond to usage on the plateform after 2015. The current usage metrics is available 48-96 hours after online publication and is updated daily on week days.
Initial download of the metrics may take a while.


