Free Access
Fig. C.1
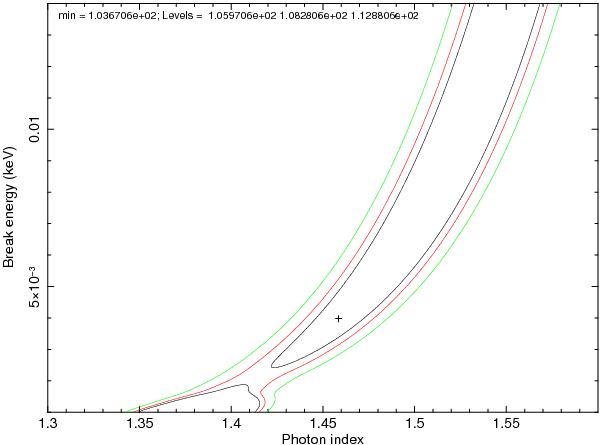
Contour plot of the best-fit parameters: the photon index Γ, defined as Γ = βo + 1, and the break energy. The contours correspond to regions of 68%, 90%, and 99% confidence level for two parameters. The χ2 values for the different levels are shown in the figure.
Current usage metrics show cumulative count of Article Views (full-text article views including HTML views, PDF and ePub downloads, according to the available data) and Abstracts Views on Vision4Press platform.
Data correspond to usage on the plateform after 2015. The current usage metrics is available 48-96 hours after online publication and is updated daily on week days.
Initial download of the metrics may take a while.