Fig. 12
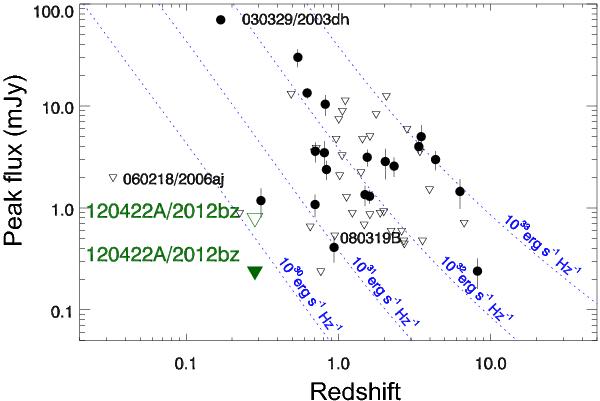
Peak flux-density measured at sub-mm/mm wavelengths vs. redshift. Triangles indicate 3σ detection limits. The deepest observed limit on the peak flux-density of GRB 120422A is displayed by the filled green triangle, while the limit from the SED modelling is highlighted by the empty green triangle. Dotted lines display flux-density levels for equal luminosity at varying redshifts. Several interesting bursts are highlighted in the figure: the high-L GRBs 030329 and 080319B and the low-L GRB 060218. Figure adapted from de Ugarte Postigo et al. (2012b).
Current usage metrics show cumulative count of Article Views (full-text article views including HTML views, PDF and ePub downloads, according to the available data) and Abstracts Views on Vision4Press platform.
Data correspond to usage on the plateform after 2015. The current usage metrics is available 48-96 hours after online publication and is updated daily on week days.
Initial download of the metrics may take a while.