Fig. 10
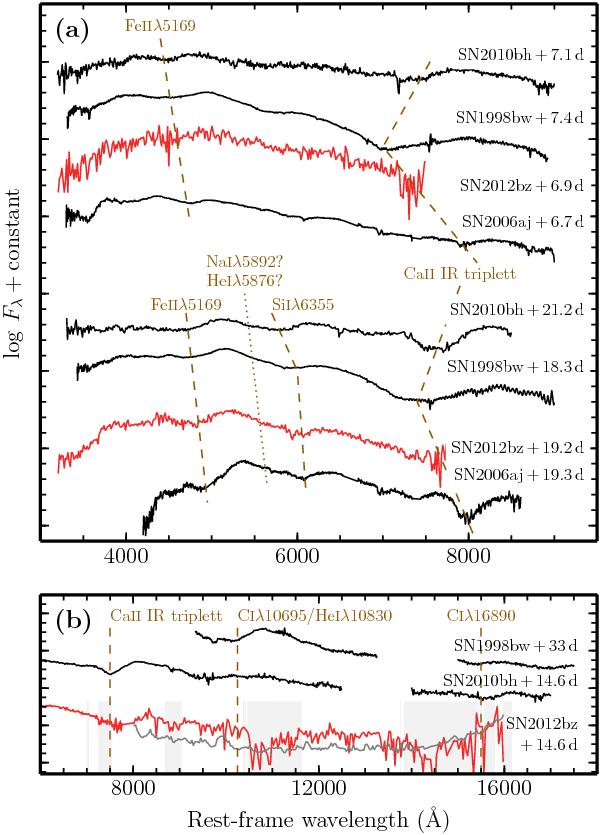
a) Comparison of SN 2012bz (blue) to spectra of low-L GRB SNe (black) at two different phases, ~ 7 and ~ 20 days past explosion, respectively. All comparisons are made in the rest frame. The dashed lines connect the approximate minima for the Fe ii and Si ii features, and the spectra are shown in an expansion velocity sequence from the fastest (SN 2010bh) to the slowest (SN 2006aj). A less significant (but real) feature that has been proposed to be He i or Na i is also identified. b) NIR arm of the X-shooter spectrum of SN 2012bz at maximum light (blue). The thin grey line is the error spectrum. The Ca ii IR triplet at the redshift of SN 2012bz is located between the VIS and NIR arms. For comparison, NIR spectra of SN 1998bw and SN 2010bh are shown along with identification of the most prominent lines (Patat et al. 2001; Bufano et al. 2012). Unfortunately, these features fall in unfavourable noisy regions of our spectrum. Positions of atmospheric features (shifted to the redshift of GRB 120422A) are highlighted by the grey-shaded areas.
Current usage metrics show cumulative count of Article Views (full-text article views including HTML views, PDF and ePub downloads, according to the available data) and Abstracts Views on Vision4Press platform.
Data correspond to usage on the plateform after 2015. The current usage metrics is available 48-96 hours after online publication and is updated daily on week days.
Initial download of the metrics may take a while.