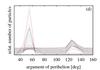
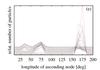
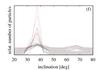
Fig. 5
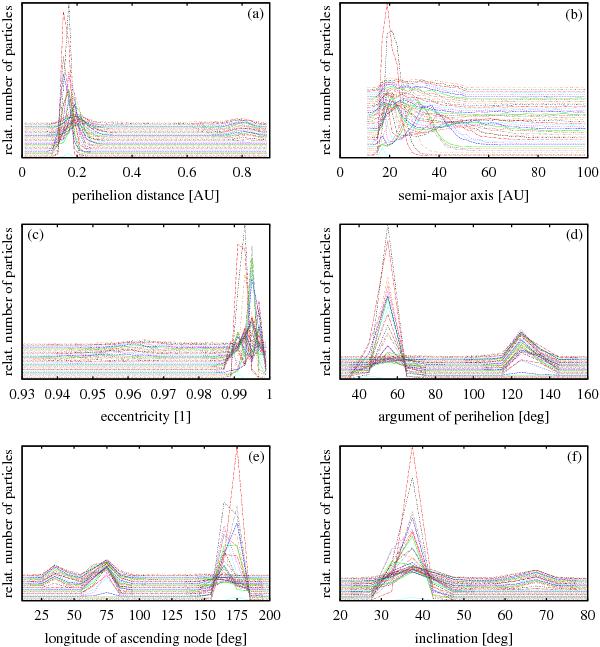
Evolution of the distribution of perihelion distance a), semi-major axis b), eccentricity c), argument of perihelion d), longitude of ascending node e), and inclination to the ecliptic f) for the part of the C/1917 F1 stream modeled at a time 40000 years before the present. The bottom curve in each plot shows the initial distribution of a given element. Each successive curve, which is entirely shifted vertically about a small displacement above the previous one, shows the distribution after another 1000 years. The top curve shows the distribution at the present.
Current usage metrics show cumulative count of Article Views (full-text article views including HTML views, PDF and ePub downloads, according to the available data) and Abstracts Views on Vision4Press platform.
Data correspond to usage on the plateform after 2015. The current usage metrics is available 48-96 hours after online publication and is updated daily on week days.
Initial download of the metrics may take a while.