Free Access
Fig. 7
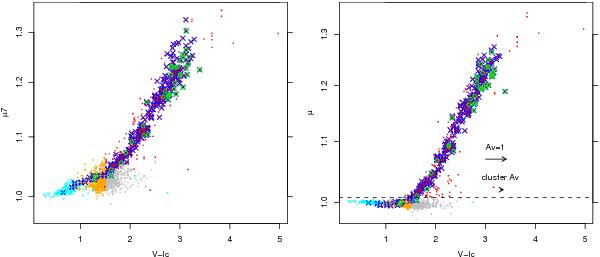
(a), left): molecular index μ7 vs. V − Ic. (b), right): mean molecular index μ vs. V − Ic. Symbols as in Fig. 1. In panel b), a representative reddening vector is indicated, as well as the very small cluster reddening vector. The horizontal dashed line indicates the limiting value μ0.
Current usage metrics show cumulative count of Article Views (full-text article views including HTML views, PDF and ePub downloads, according to the available data) and Abstracts Views on Vision4Press platform.
Data correspond to usage on the plateform after 2015. The current usage metrics is available 48-96 hours after online publication and is updated daily on week days.
Initial download of the metrics may take a while.