Fig. 15
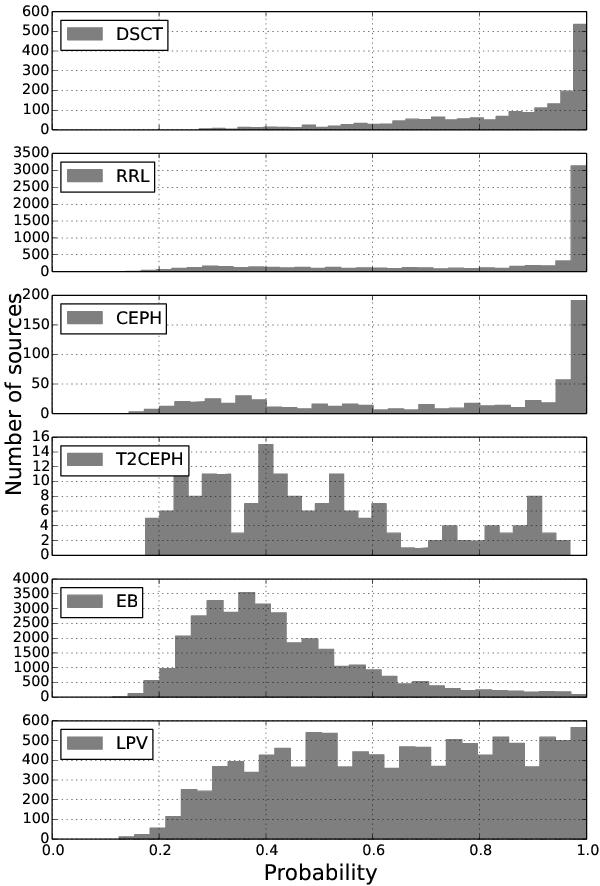
Probability histograms of the new variable candidates. Although most of DSCTs, RRLs, and CEPHs show a probability higher than 90%, a relatively large portion of candidates of T2CEPHs, EBs, and LPVs show a probability lower than 0.9, which might be caused by misclassification within or between superclasses.
Current usage metrics show cumulative count of Article Views (full-text article views including HTML views, PDF and ePub downloads, according to the available data) and Abstracts Views on Vision4Press platform.
Data correspond to usage on the plateform after 2015. The current usage metrics is available 48-96 hours after online publication and is updated daily on week days.
Initial download of the metrics may take a while.