Fig. 10
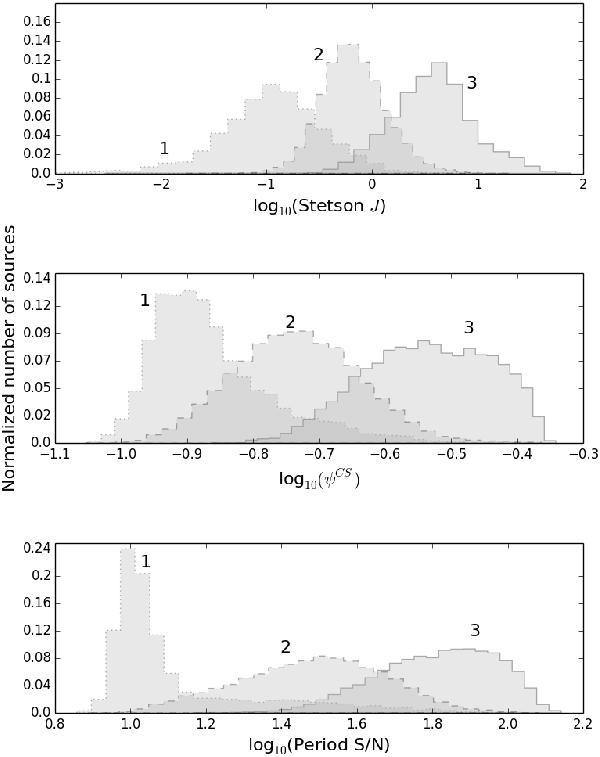
Histograms of three variability features, Stetson J, ψCS, and period S/N (from top to bottom). Each panel shows three histograms, each of which is a histogram of 1) non-variables (dotted line) in the training set; 2) the visually removed LPVs (dashed line); and 3) LPVs (solid line) in the training set. See text for details.
Current usage metrics show cumulative count of Article Views (full-text article views including HTML views, PDF and ePub downloads, according to the available data) and Abstracts Views on Vision4Press platform.
Data correspond to usage on the plateform after 2015. The current usage metrics is available 48-96 hours after online publication and is updated daily on week days.
Initial download of the metrics may take a while.