Free Access
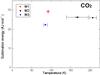
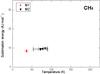
Fig. 4
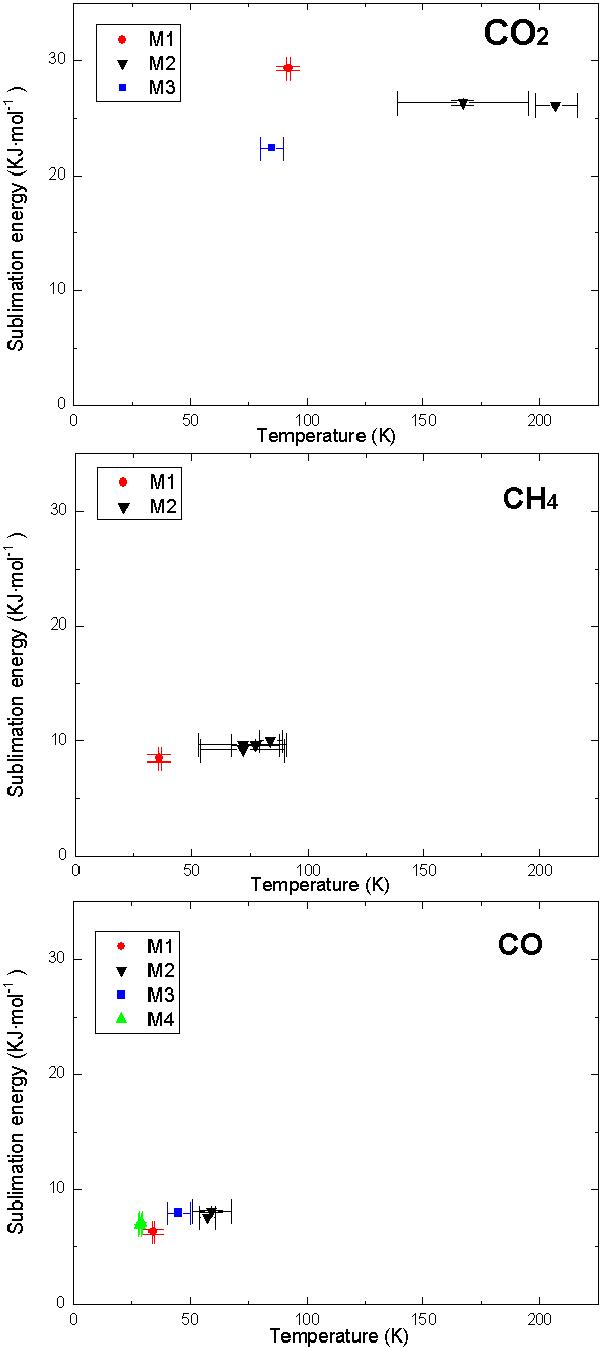
Comparison of sublimation energy obtained by different methods for CO2, CH4, and CO. In all plots our experiments (M1) are represented by solid circles. Inverted triangles represent the experiments measured by M2, squares represent results reported by M3, and triangles those obtained by M4.
This figure is made of several images, please see below:
Current usage metrics show cumulative count of Article Views (full-text article views including HTML views, PDF and ePub downloads, according to the available data) and Abstracts Views on Vision4Press platform.
Data correspond to usage on the plateform after 2015. The current usage metrics is available 48-96 hours after online publication and is updated daily on week days.
Initial download of the metrics may take a while.