Fig. 3
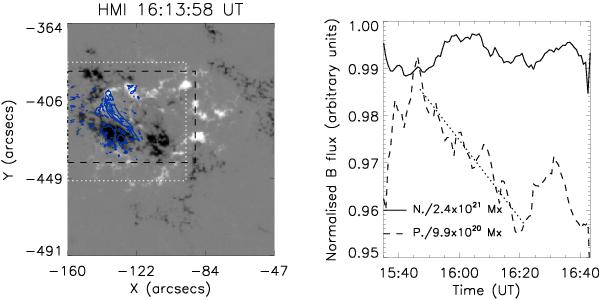
Left: HMI longitudinal magnetogram of the flare scaled from –1 kG to 1 kG. The region enclosed with dotted lines is the IBIS field of view. The overplotted contours (blue lines) outline the filament and two of the sunspots in the flaring region. Right: lightcurves of the normalised (to the maximum) magnetic flux from the region shown with black dashed line in the left panel. The solid line indicates the variation of the negative flux while the dashed line is the positive one. The cancellation rate of the positive flux is obtained from the linear fit of the positive flux lightcurve shown here with a dotted straight line.
Current usage metrics show cumulative count of Article Views (full-text article views including HTML views, PDF and ePub downloads, according to the available data) and Abstracts Views on Vision4Press platform.
Data correspond to usage on the plateform after 2015. The current usage metrics is available 48-96 hours after online publication and is updated daily on week days.
Initial download of the metrics may take a while.