Fig. 2
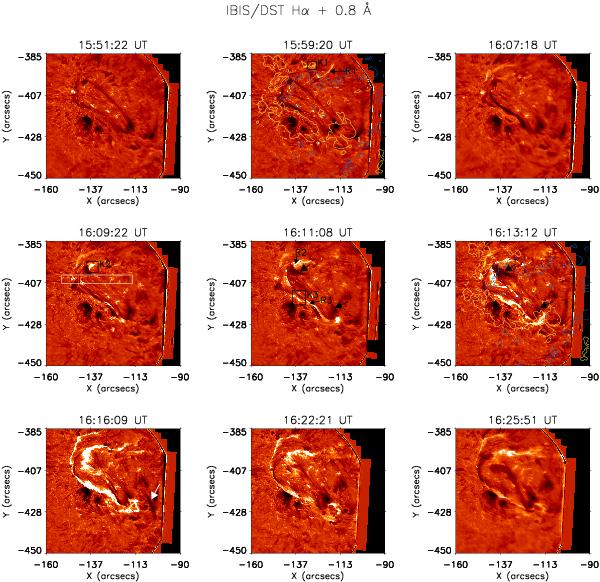
Filament eruption and flare ribbon seen in Hα+ 0.8 Å. Larger black arrows indicate the footpoints of the filament where down-flows are observed (at 16:11 UT). Three kernels (K1, K2, and K3) are noted on the images at 15:59 UT, 16:09 UT, and 16:11 UT, respectively. The ribbons (R1, R2, and R2) are shown with arrows in the images at 15:59 UT and 16:11 UT. The white box in the image at 16:09 UT indicates the region used to produce the time-slice plot in Fig. 4. The white arrow at 16:16:09 UT marks the top of the falling back filament ropes (or part of it). Contour plots of HMI magnetogram are shown in images at 16:07:11 UT and 16:09:15 UT (yellow: −300 Mx cm-2, blue: 300 Mx cm-2).
Current usage metrics show cumulative count of Article Views (full-text article views including HTML views, PDF and ePub downloads, according to the available data) and Abstracts Views on Vision4Press platform.
Data correspond to usage on the plateform after 2015. The current usage metrics is available 48-96 hours after online publication and is updated daily on week days.
Initial download of the metrics may take a while.