Fig. 6
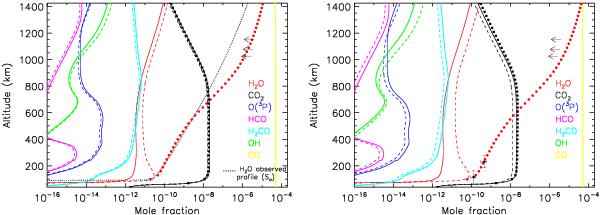
Evolution of oxygen species after a cometary impact. Initial conditions correspond to deposition of CO and H2O with uniform mixing ratios (with qCO = 10 qH2O) above 300 km. Left panel: models suited to the Herschel H2O profile (Sa from Moreno et al. (2012)). Dashed lines: “small comet” (initial qCO = 6 × 10⁻⁵), evolution time tevol = 300 yr. Solid lines: “large comet” (initial qCO = 6 × 10⁻⁴), evolution time tevol = 700 yr. The red circles and black squares show the H2O and CO2 for the combination of the “large comet” case with a steady OH influx of 2.4 × 105 cm-2 s-1. Right panel: models suited to the Cassini/CIRS H2O profile Cottini et al. (2012). Dashed lines: “smaller comet” (initial qCO = 3 × 10⁻⁵), evolution time tevol = 225 yr. Solid lines: “large comet” (initial qCO = 6 × 10⁻⁴), evolution time tevol = 700 yr. The red circles and black squares show the H2O and CO2 for the combination of the “large comet” case with a steady OH influx of 9.0 × 105 cm-2 s-1. Upper limits on H2O thermospheric abundance by Cui et al. (2009) are also shown as arrows.
Current usage metrics show cumulative count of Article Views (full-text article views including HTML views, PDF and ePub downloads, according to the available data) and Abstracts Views on Vision4Press platform.
Data correspond to usage on the plateform after 2015. The current usage metrics is available 48-96 hours after online publication and is updated daily on week days.
Initial download of the metrics may take a while.