Fig. 5
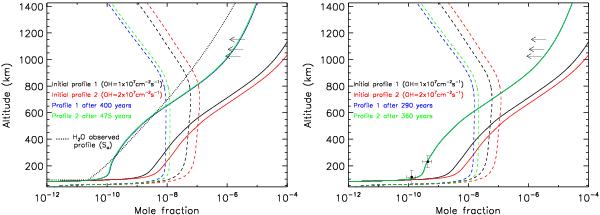
H2O (solid lines) and CO2 (dashed lines) profiles in a time-dependent Enceladus source model (H08 chemistry) compared to the observed profile of H2O from (i) left panel: Herschel (Sa profile from Moreno et al. (2012); and (ii) right panel: Cassini/CIRS (Cottini et al. 2012) . Two initial conditions with different and enhanced OH input fluxes (1.0 × 10⁷ in black lines and 2.0 × 107 cm-2 s-1 in red lines) are considered. Evolution times are adjusted so that the H2O mole fraction above 300 km matches observations in the case of Herschel data and at 230 km in the case of Cassini/CIRS. The resulting (i.e., after t0 yr of evolution) H2O and CO2 profiles are plotted with blue and green lines for the initial profiles 1 and 2, respectively (see text for more details). Upper limits on H2O thermospheric abundance by Cui et al. (2009) are also shown as arrows.
Current usage metrics show cumulative count of Article Views (full-text article views including HTML views, PDF and ePub downloads, according to the available data) and Abstracts Views on Vision4Press platform.
Data correspond to usage on the plateform after 2015. The current usage metrics is available 48-96 hours after online publication and is updated daily on week days.
Initial download of the metrics may take a while.