Fig. 4
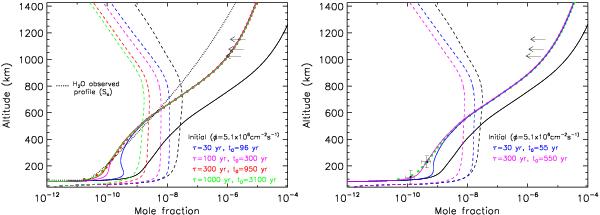
H2O (solid lines) and CO2 (dashed lines) profiles in a time-dependent Enceladus source model, as compared to observations, making use of the H08 chemical scheme. Left panel: results aimed at fitting the H2O observed with Herschel. The profiles are initialized at their steady-state values for a OH flux of 5.1 × 106 cm-2 s-1 (black curves). The different curves correspond to evolution with four different combinations of τ and t0. The red circles show the H2O profile in the (τ = 30 yr, t0 = 96 yr) case calculated in presence of an additional loss of H2O to the haze (see text). Right panel: results aimed at fitting the H2O observed with Cassini/CIRS. The black curves correspond to the steady state profiles obtained with an OH flux of 5.1 × 106 cm-2 s-1. Evolution of these profiles for two different (τ,t0) combinations are shown, as well as the resulting H2O profile, when a loss to the haze is taken into account for the (τ = 30 yr, t0 = 55 yr) case (green dots). Upper limits on H2O thermospheric abundance by Cui et al. (2009) are also shown as arrows.
Current usage metrics show cumulative count of Article Views (full-text article views including HTML views, PDF and ePub downloads, according to the available data) and Abstracts Views on Vision4Press platform.
Data correspond to usage on the plateform after 2015. The current usage metrics is available 48-96 hours after online publication and is updated daily on week days.
Initial download of the metrics may take a while.