Fig. 3
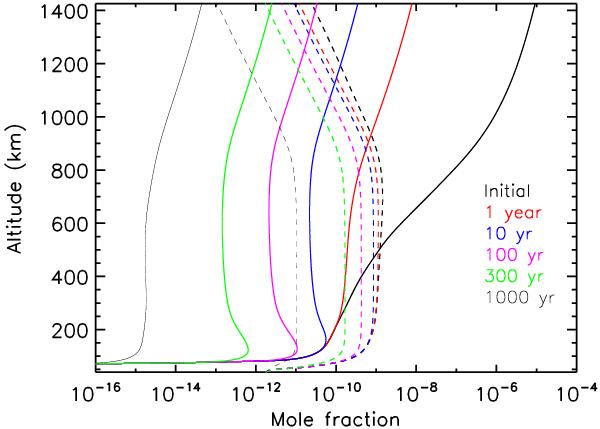
Time-evolution of oxygen species 1, 10, 100, 300 and 1000 yr after the oxygen sources have been abruptly cut-off. Profiles are initialized at steady-state conditions for O(3P) and OH input fluxes at 1.6 × 10⁶ and 2.4 × 105 cm-2 s-1, respectively, matching the H2O profile of Moreno et al. (2012). Solid lines refer to H2O, and dashed lines refer to CO2.
Current usage metrics show cumulative count of Article Views (full-text article views including HTML views, PDF and ePub downloads, according to the available data) and Abstracts Views on Vision4Press platform.
Data correspond to usage on the plateform after 2015. The current usage metrics is available 48-96 hours after online publication and is updated daily on week days.
Initial download of the metrics may take a while.