Fig. 2
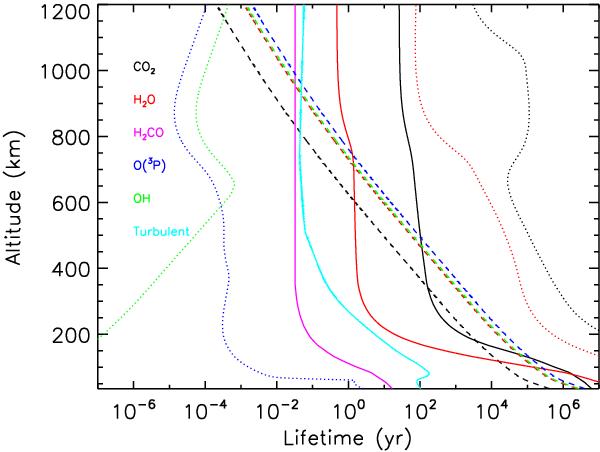
Lifetimes for different processes. Solid lines: photolytic lifetime Dotted lines: chemical (gas-gas) lifetime. Dashed lines: molecular diffusion timescale. ( ). The characteristic time for turbulent transport (H2/K) is also shown. This figure makes use of the H08 chemical scheme, where OH photolysis is not included, and H2CO is only lost via photodissociation.
Current usage metrics show cumulative count of Article Views (full-text article views including HTML views, PDF and ePub downloads, according to the available data) and Abstracts Views on Vision4Press platform.
Data correspond to usage on the plateform after 2015. The current usage metrics is available 48-96 hours after online publication and is updated daily on week days.
Initial download of the metrics may take a while.