Fig. 5

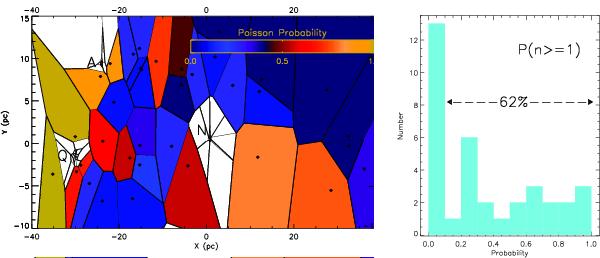
Left: density map of the observed massive stars (Mauerhan et al. 2010a) is derived using Voronoi diagrams. The Voronoi cells are colored according to their calculated Poisson probability of observing one or more stars in each cell, P(n ≥ 1), based on our best model. The color-bar assigns colors to the calculated probabilities. White regions contain the cluster central members and are discarded from the probability calculations. Right: distribution of calculated Poisson probabilities, P(n ≥ 1), is shown. Our model reproduces at least one star in ten random realizations, P(n ≥ 1) > 10%, for 62% of the observed isolated massive stars. Please note that the Voronoi cells appear skewed due to different scales for the x and y axis.
Current usage metrics show cumulative count of Article Views (full-text article views including HTML views, PDF and ePub downloads, according to the available data) and Abstracts Views on Vision4Press platform.
Data correspond to usage on the plateform after 2015. The current usage metrics is available 48-96 hours after online publication and is updated daily on week days.
Initial download of the metrics may take a while.


