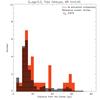
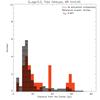
Fig. 4

Line-filled histograms depict the average distribution of the massive sources, M> 40 M⊙, in the ten random realizations of the best-matching model. Stars within the central 1.6 pc of the simulated Arches and Quintuplet clusters are excluded. Red filled histograms illustrate the distribution of the observed massive sources. Distances are calculated with reference to the center of the Arches cluster. Left: the comparison is based on the full list of WR stars and OB supergiants presented by Mauerhan et al. (2010a). Right: OB super giants are excluded from the observed catalog and the comparison is based on the population of WRs in the region.
Current usage metrics show cumulative count of Article Views (full-text article views including HTML views, PDF and ePub downloads, according to the available data) and Abstracts Views on Vision4Press platform.
Data correspond to usage on the plateform after 2015. The current usage metrics is available 48-96 hours after online publication and is updated daily on week days.
Initial download of the metrics may take a while.


