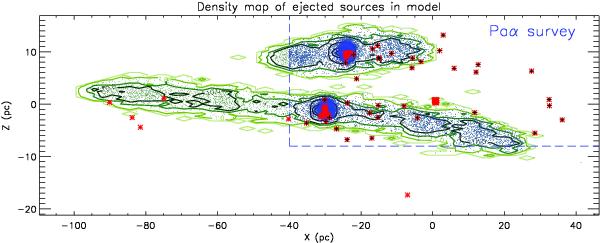
Fig. 3

Contour density map for one of the realizations of the best-matching model with an age of 2.5 and 5 Myr for the Arches and Quintuplet clusters, respectively, and an initial mass of 40 M⊙ for massive stars is presented with different shades of green lines. Darker colors indicate higher densities. The isolated massive stars observed by Mauerhan et al. (2010a) are marked with red asterisks. The dashed lines approximately represent the border of the Paα survey. This line separates the region where we perform our comparison between the model and the data. We include some of the observed sources outside the Paα survey area for illustration. Only the observed sources, as shown by red asterisks, which are marked with black crosses are used to compare observations to the models. Blue (green) dots represent the simulated cluster members, which are included (excluded) for the comparison analysis. The x-axis is along the Galactic plane, and the z-axis is toward the Galactic north pole.
Current usage metrics show cumulative count of Article Views (full-text article views including HTML views, PDF and ePub downloads, according to the available data) and Abstracts Views on Vision4Press platform.
Data correspond to usage on the plateform after 2015. The current usage metrics is available 48-96 hours after online publication and is updated daily on week days.
Initial download of the metrics may take a while.


