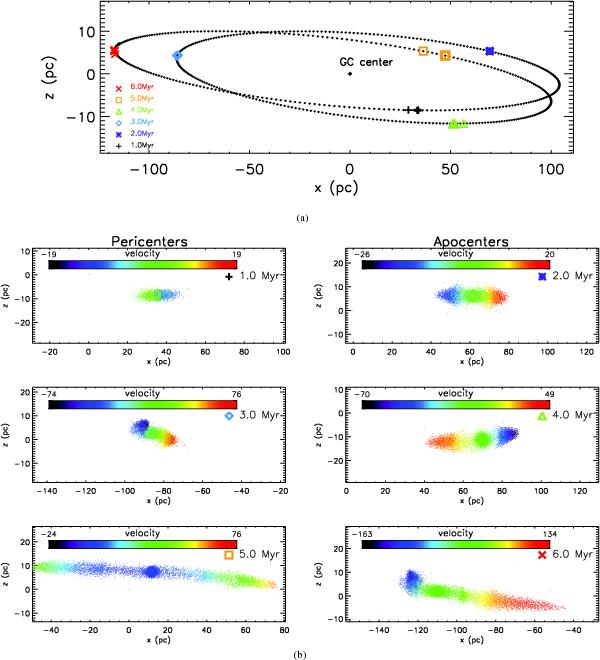
Fig. A.1

a) Projected orbit of the cluster on the plane of the sky, xz-plane, is illustrated. The symbols on the orbit mark the apsides of the 3D orbit. Each symbol/color corresponds to a particular age. The thick symbols display the exact position of the apsides, while the thin symbols refer to the closest available snapshot of the simulated cluster by considering the time resolution of the simulations. b) Projected snapshots of the cluster on the plane of the sky are shown at apocenters and pericenters. Each snapshot corresponds to one marked apside on the projected orbit. The sources are colored based on the present velocity variation in the cluster and its tidal tails.
Current usage metrics show cumulative count of Article Views (full-text article views including HTML views, PDF and ePub downloads, according to the available data) and Abstracts Views on Vision4Press platform.
Data correspond to usage on the plateform after 2015. The current usage metrics is available 48-96 hours after online publication and is updated daily on week days.
Initial download of the metrics may take a while.


