Fig. 8
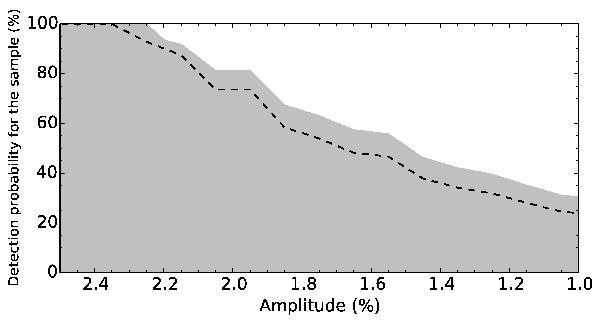
Proportion of the survey sensitive to variability as a function of peak-to-trough amplitudes for different detection thresholds. The dashed line represents the fraction of objects with a photometric accuracy good enough to have allowed for the detection of variability. The shaded area represents the region of sensitivity with the upper binomial errors and amplitude uncertainties added to the variability fraction.
Current usage metrics show cumulative count of Article Views (full-text article views including HTML views, PDF and ePub downloads, according to the available data) and Abstracts Views on Vision4Press platform.
Data correspond to usage on the plateform after 2015. The current usage metrics is available 48-96 hours after online publication and is updated daily on week days.
Initial download of the metrics may take a while.