Fig. 4
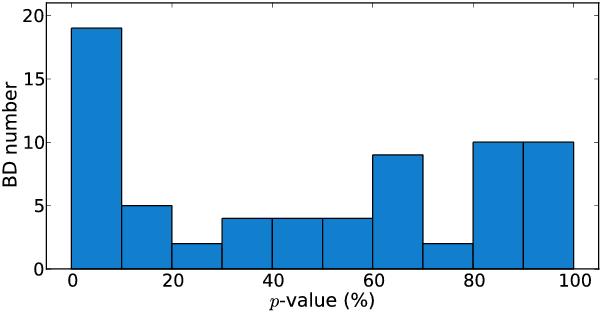
p-value histogram of the full brown dwarf sample. The objects in the first bin include 16 targets with p-value ≤ 5%, and three targets with p-value between 5−10%. Of the 16 targets with p-value ≤5% listed in Table 3, two targets are not listed since they failed the robust criterion ( ). The large number of objects in the last two bins (80 to 100) is suggestive of conservative error bars.
Current usage metrics show cumulative count of Article Views (full-text article views including HTML views, PDF and ePub downloads, according to the available data) and Abstracts Views on Vision4Press platform.
Data correspond to usage on the plateform after 2015. The current usage metrics is available 48-96 hours after online publication and is updated daily on week days.
Initial download of the metrics may take a while.