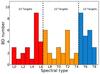
Fig. 2
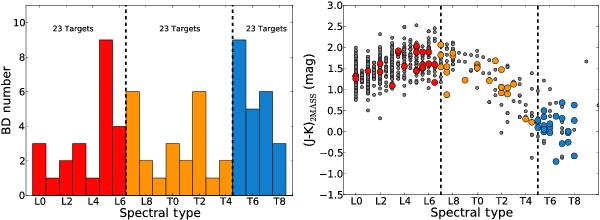
Diagram on the left shows a histogram of the sample across their respective spectral classes, whilst on the right is a colour−colour diagram showing the J − K colours of the same (coloured circles) overplotted on the full brown dwarf L−T spectral sequence (small grey circles). The L–T transition is indicated by the dashed lines defined in Golimowski et al. (2004).
Current usage metrics show cumulative count of Article Views (full-text article views including HTML views, PDF and ePub downloads, according to the available data) and Abstracts Views on Vision4Press platform.
Data correspond to usage on the plateform after 2015. The current usage metrics is available 48-96 hours after online publication and is updated daily on week days.
Initial download of the metrics may take a while.