Fig. 11
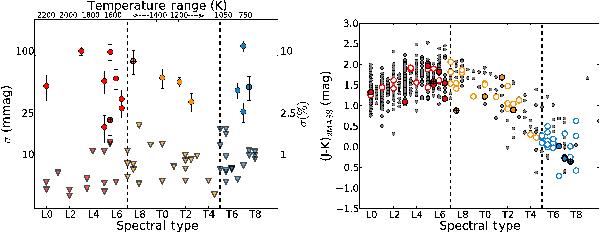
Left: amplitude of the variables (p-value ≤5% as closed circles and 5% <p-value ≤ 10% as closed circles with cross) and target photometric uncertainty of the non-varying objects (coloured triangles) across the entire spectral range of the sample. Right: colour−colour diagram of the entire L through T spectral range with the full sample plotted with open circles, showing the colour spread of the targets. The variables from the BAM sample are overplotted (p-value ≤5% as closed circles and 5% <p-value ≤ 10% as closed circles with cross). The L–T transition is indicated by the dashed lines.
Current usage metrics show cumulative count of Article Views (full-text article views including HTML views, PDF and ePub downloads, according to the available data) and Abstracts Views on Vision4Press platform.
Data correspond to usage on the plateform after 2015. The current usage metrics is available 48-96 hours after online publication and is updated daily on week days.
Initial download of the metrics may take a while.