Fig. 10
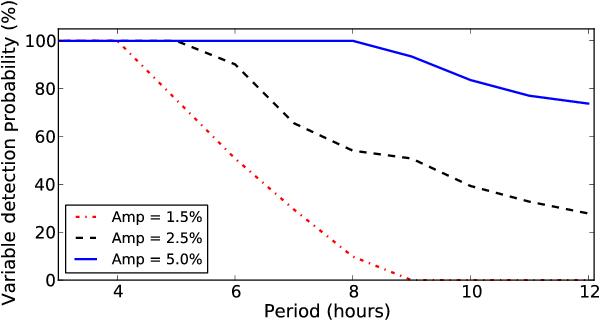
Percentage of simulated sinusoidal light curves detected as variable, as a function of period from 1 h to 12 h, for three different amplitudes. We used the measured survey median noise of 0.7%, and each sine curve was sampled at intervals of 15 min to imitate the binned data of the survey. Additionally, we stepped through each sine curve at 5 degree phase intervals, to ensure that we sampled the full phase of the variable light curve.
Current usage metrics show cumulative count of Article Views (full-text article views including HTML views, PDF and ePub downloads, according to the available data) and Abstracts Views on Vision4Press platform.
Data correspond to usage on the plateform after 2015. The current usage metrics is available 48-96 hours after online publication and is updated daily on week days.
Initial download of the metrics may take a while.