Fig. 1
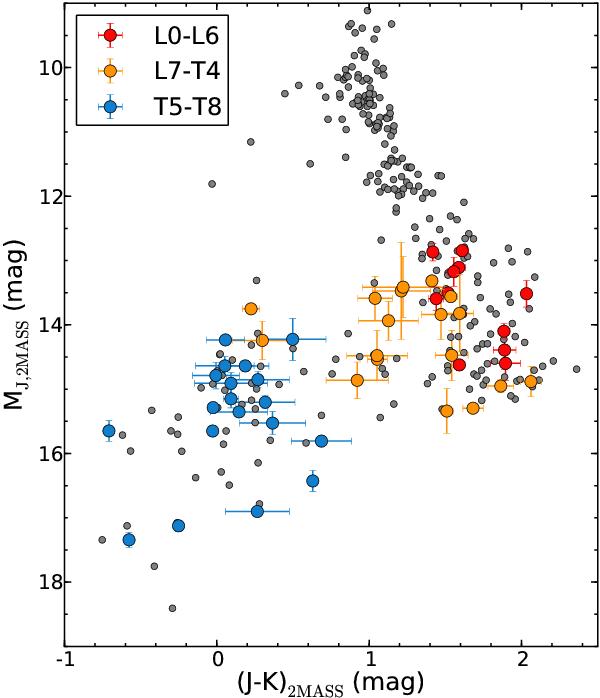
Colour−magnitude diagram of the M−L−T spectrum (small grey circles). All brown dwarfs with known parallax in the BAM sample are overplotted, with red representing the L dwarfs, yellow the L–T transition dwarfs, and blue the T dwarfs (see Tables 1 and 2). Half spectral types have been rounded down in the study. The photometry and parallaxes for the field M−L−T objects are from Dupuy & Liu (2012).
Current usage metrics show cumulative count of Article Views (full-text article views including HTML views, PDF and ePub downloads, according to the available data) and Abstracts Views on Vision4Press platform.
Data correspond to usage on the plateform after 2015. The current usage metrics is available 48-96 hours after online publication and is updated daily on week days.
Initial download of the metrics may take a while.