Fig. 3
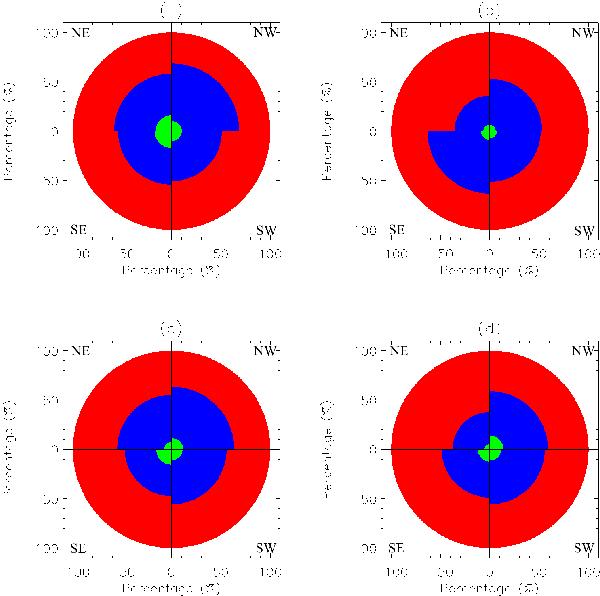
Polar area diagrams showing flows in four quadrants in the three subfields. The percentage of BPs in a quadrant that move towards (blue) and away from (red) the reference point are represented alongside those BPs that experience no change throughout their lifetime (green). The percentage for each flow direction in each individual quadrant is stacked as concentric arcs to aid the visualisation of flow directions within a quadrant. a), b), and c) show the flows with reference to the centre of the subfield in region 1, 2, and 3, respectively. d) shows the flows with respect to the neutral line found in region 3 with HMI LOS magnetograms.
Current usage metrics show cumulative count of Article Views (full-text article views including HTML views, PDF and ePub downloads, according to the available data) and Abstracts Views on Vision4Press platform.
Data correspond to usage on the plateform after 2015. The current usage metrics is available 48-96 hours after online publication and is updated daily on week days.
Initial download of the metrics may take a while.