Fig. 2
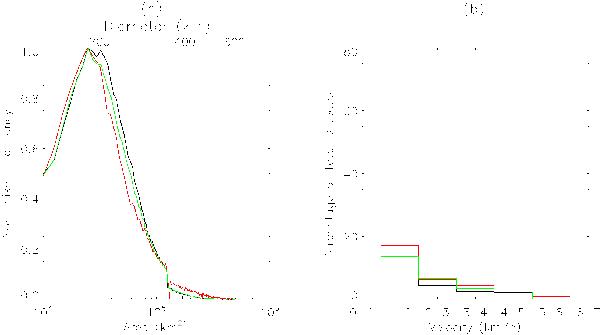
a) A semi-log graph of the area distributions for the BPs observed in region 1 (black), region 2 (red) and region 3 (green). Regions with higher field strengths show slightly larger and broader peaks. Velocity histograms for the three subfields studied in AR 11372 are shown in b). Again, black, red, and green represent the distributions for region 1, 2, and 3, respectively. The quiet region (region 2) shows the presence of more elevated velocities than those found in the two more active regions.
Current usage metrics show cumulative count of Article Views (full-text article views including HTML views, PDF and ePub downloads, according to the available data) and Abstracts Views on Vision4Press platform.
Data correspond to usage on the plateform after 2015. The current usage metrics is available 48-96 hours after online publication and is updated daily on week days.
Initial download of the metrics may take a while.