Fig. 1
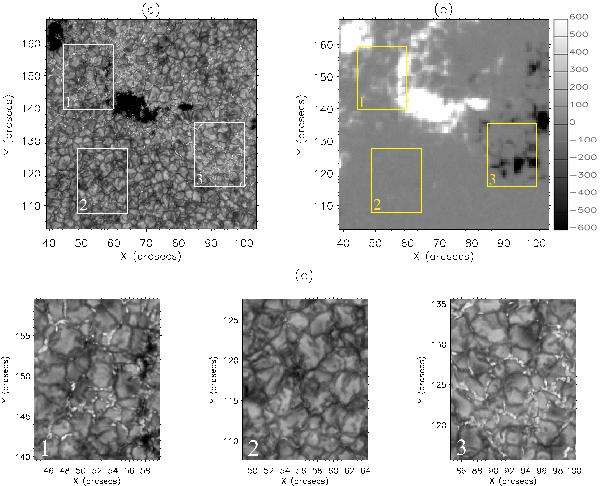
a) Full field-of-view of the ROSA G-band image of AR 11372. b) Corresponding HMI magnetogram. The white boxes in a) and the yellow boxes in b) show the three subfields used in the study which are expanded in c). The numbers in the boxes indicate which boxes in the full field-of-view correspond to their respective expanded views. A colour bar in b) indicates the magnetic flux density (in Gauss), saturated at ±600 G to assist visualisation of the field complexities.
Current usage metrics show cumulative count of Article Views (full-text article views including HTML views, PDF and ePub downloads, according to the available data) and Abstracts Views on Vision4Press platform.
Data correspond to usage on the plateform after 2015. The current usage metrics is available 48-96 hours after online publication and is updated daily on week days.
Initial download of the metrics may take a while.