Fig. 8
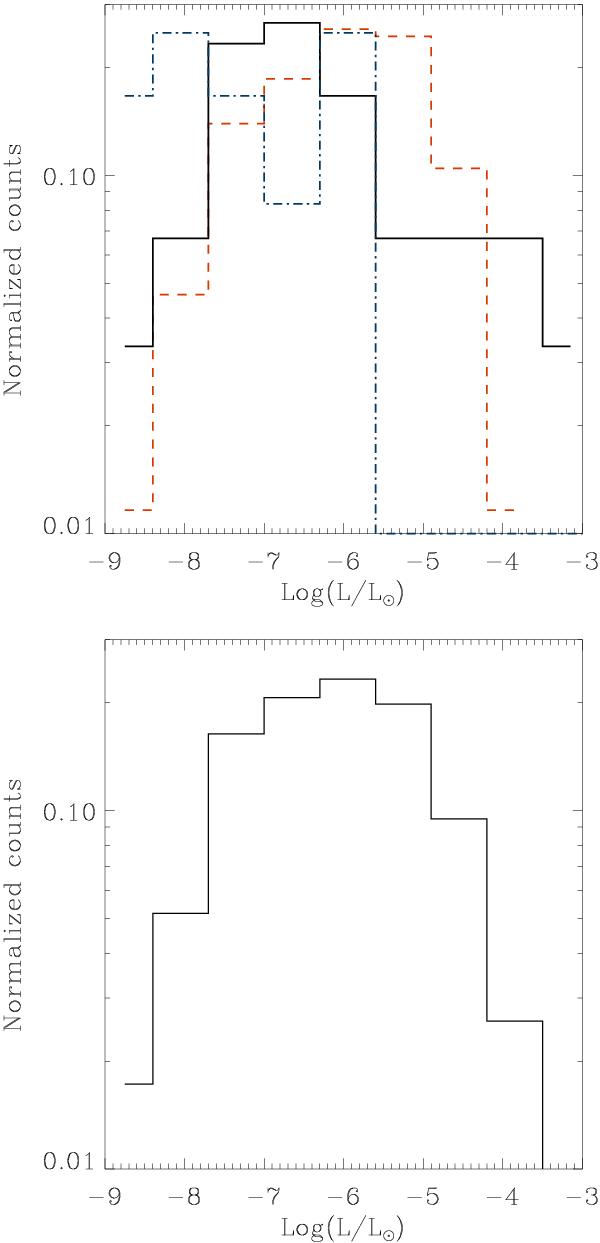
Top panel: normalized counts (number of sources per bin divided by the total number of sources) vs. luminosity of the methanol masers, for both the Pandian et al. (2007, 2009) data (red dashed line) and our own results (including new and known masers) with the luminosity of both the methanol (black solid line) and OH masers (blue dash-dotted line). Bottom panel: normalized counts vs. luminosity of all methanol masers from both our survey and the AMGPS.
Current usage metrics show cumulative count of Article Views (full-text article views including HTML views, PDF and ePub downloads, according to the available data) and Abstracts Views on Vision4Press platform.
Data correspond to usage on the plateform after 2015. The current usage metrics is available 48-96 hours after online publication and is updated daily on week days.
Initial download of the metrics may take a while.