Fig. 10
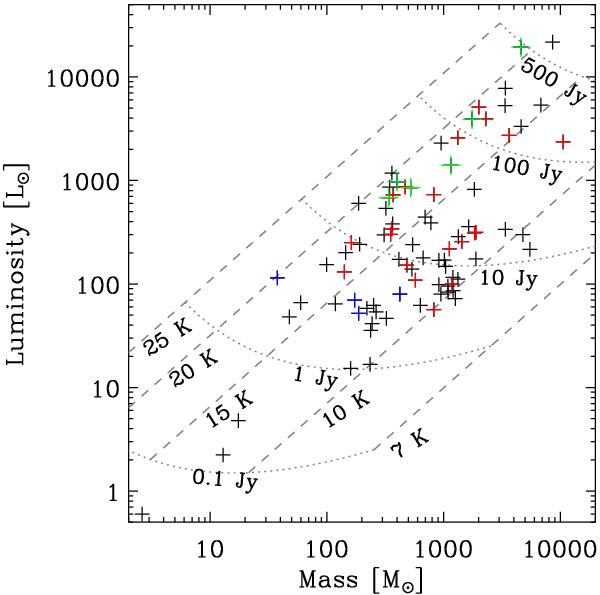
Luminosity versus mass for all clumps (black “+” signs) observed at Arecibo, estimated using the distances listed in Table 1. Sources where a methanol or OH maser has been detected are shown in red and blue, respectively; sources with both masers are shown in green (both newly detected and previously known masers are shown). The dashed lines are loci at constant T = 10, 20, 30, and 40 K. Roughly orthogonal to these are loci (dotted lines) of constant 250 μm flux density, ranging from 0.1 to 500 Jy (assuming a modified blackbody spectral energy distribution with β = 1.5 and a fixed, “typical” distance of ~6 kpc).
Current usage metrics show cumulative count of Article Views (full-text article views including HTML views, PDF and ePub downloads, according to the available data) and Abstracts Views on Vision4Press platform.
Data correspond to usage on the plateform after 2015. The current usage metrics is available 48-96 hours after online publication and is updated daily on week days.
Initial download of the metrics may take a while.