Fig. 8
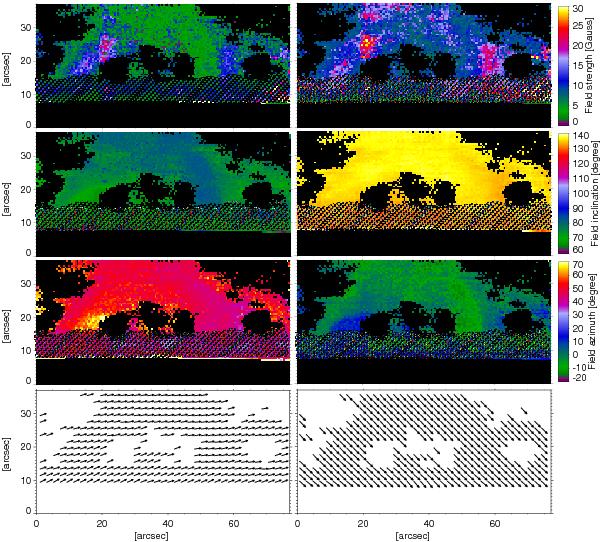
Field strength, inclination, and azimuth maps resulting from the inversion of the observed Stokes profiles with the HAZEL code. Each column represents one of the two 90° ambiguous solutions, quasi-horizontal (left) and quasi-vertical (right). As in Fig. 1, the black bottom region represents the solar disk. The rest of the dark areas correspond to pixels whose Stokes Q/I and U/I signals did not exceed 5 times their corresponding noise levels.
Current usage metrics show cumulative count of Article Views (full-text article views including HTML views, PDF and ePub downloads, according to the available data) and Abstracts Views on Vision4Press platform.
Data correspond to usage on the plateform after 2015. The current usage metrics is available 48-96 hours after online publication and is updated daily on week days.
Initial download of the metrics may take a while.