Fig. 5
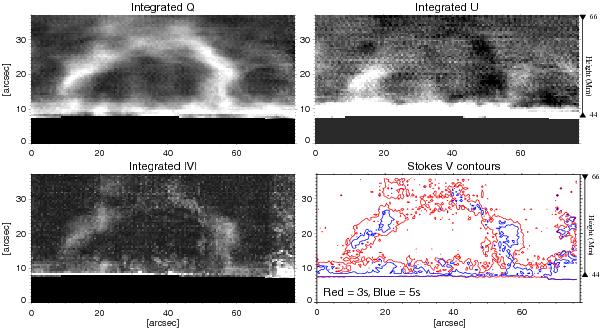
Stokes Q, U, and | V | wavelength integrated maps calculated by integrating the observed Stokes profiles. The integral covered 21 wavelength samples centered on the position of maximum emission. The bottom right panel shows contour plots representing the areas where the peak amplitude of the Stokes | V | signal surpasses three and five times the noise level σ. Note that σ is pixel dependent since each Stokes parameter is normalized to its Stokes I maximum amplitude. As in Fig. 1, the bottom part represents the limb and the right axis the height in Mm.
Current usage metrics show cumulative count of Article Views (full-text article views including HTML views, PDF and ePub downloads, according to the available data) and Abstracts Views on Vision4Press platform.
Data correspond to usage on the plateform after 2015. The current usage metrics is available 48-96 hours after online publication and is updated daily on week days.
Initial download of the metrics may take a while.