Fig. 1
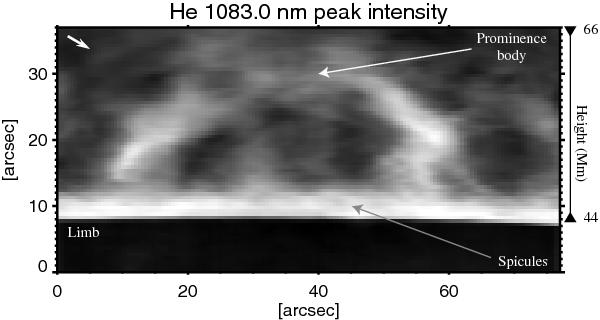
Peak intensity map of the He i 1083.0 nm triplet emission profile. The prominence is seen as a bright structure against a dark background. The lower dark part corresponds to the solar limb. The top-left arrow points to solar North. The deprojected height (see Sect. 2) above the solar surface is shown on the right axis. The data was taken 20 May 2011 at 9:44 UT and finished at 11:15 UT on the same day.
Current usage metrics show cumulative count of Article Views (full-text article views including HTML views, PDF and ePub downloads, according to the available data) and Abstracts Views on Vision4Press platform.
Data correspond to usage on the plateform after 2015. The current usage metrics is available 48-96 hours after online publication and is updated daily on week days.
Initial download of the metrics may take a while.