Free Access
Fig. 9
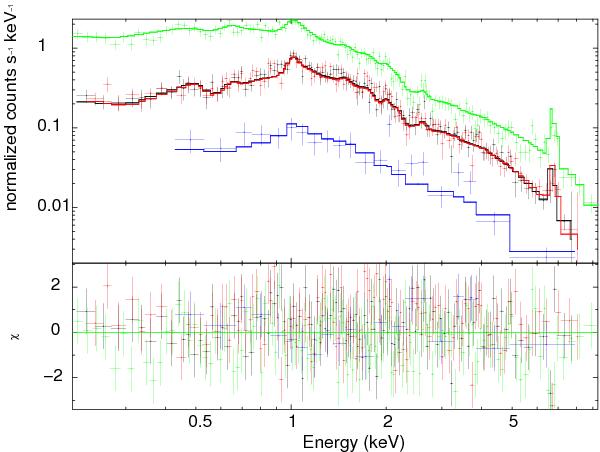
Upper panel: MOS (black and red crosses), pn (green crosses) and XRT (blue crosses) spectra together with the best-fit model (solid lines). Bottom panel: residuals between data and the best-fit model.
Current usage metrics show cumulative count of Article Views (full-text article views including HTML views, PDF and ePub downloads, according to the available data) and Abstracts Views on Vision4Press platform.
Data correspond to usage on the plateform after 2015. The current usage metrics is available 48-96 hours after online publication and is updated daily on week days.
Initial download of the metrics may take a while.