Free Access
Fig. 5
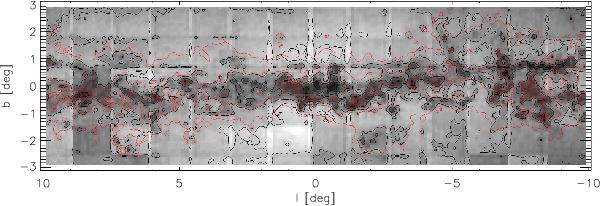
Greyscale of the star count distribution together with the contour of the 2D extinction. The lower star density is denoted in black and higher star density in white. Note that stars were counted twice in the overlapping regions of the different tiles (seen as white vertical stripes).
Current usage metrics show cumulative count of Article Views (full-text article views including HTML views, PDF and ePub downloads, according to the available data) and Abstracts Views on Vision4Press platform.
Data correspond to usage on the plateform after 2015. The current usage metrics is available 48-96 hours after online publication and is updated daily on week days.
Initial download of the metrics may take a while.