Free Access
Fig. 11
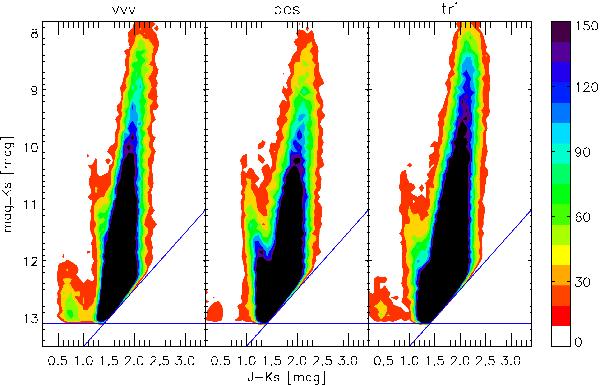
J − Ks vs. Ks colour−magnitude diagram of the field at l = 1.5°, b = + 1.5°. The left panel shows the VVV data, the middle panel the Besançon model, and the right panel the TRILEGAL model. For the two models (Besançon and Trilegal) the CMDs were broadend by adding our 3D extinction map.
Current usage metrics show cumulative count of Article Views (full-text article views including HTML views, PDF and ePub downloads, according to the available data) and Abstracts Views on Vision4Press platform.
Data correspond to usage on the plateform after 2015. The current usage metrics is available 48-96 hours after online publication and is updated daily on week days.
Initial download of the metrics may take a while.