Fig. 2
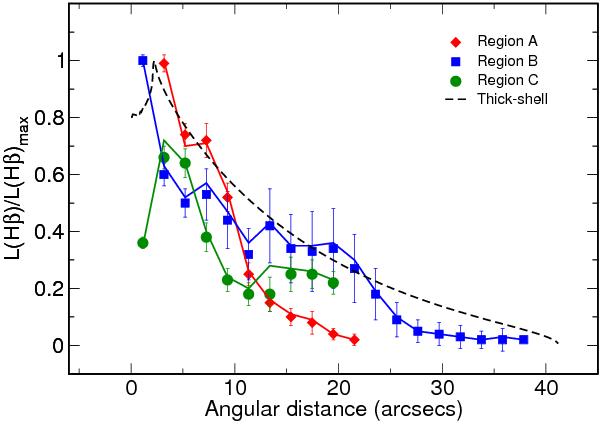
Radial profile in observed angular units of Hβ surface brightness normalised to the maximum in the three defined regions: red diamonds for region A, blue squares that is for region B, and green crosses for region C. The coloured solid lines represent the predictions made by the models in the MB thin-shell approach, while the black dashed line represents the prediction of the model in the RB thick-shell approach (see Sect. 3 for a explanation of the models).
Current usage metrics show cumulative count of Article Views (full-text article views including HTML views, PDF and ePub downloads, according to the available data) and Abstracts Views on Vision4Press platform.
Data correspond to usage on the plateform after 2015. The current usage metrics is available 48-96 hours after online publication and is updated daily on week days.
Initial download of the metrics may take a while.