Fig. 13
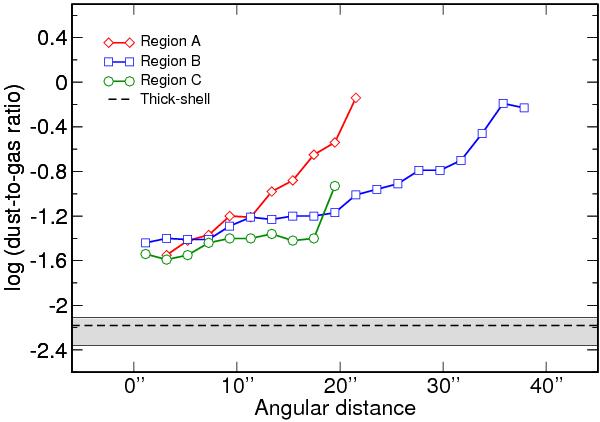
Radial variation of the dust-to-gas mass ratio obtained in the MB thin-shell models for the three studied regions (symbols joined by solid lines) and in the RB thick-shell models (dashed line). The grey band represents the dust/gas ratio derived from the integrated IR observations of the nebula and the mass of H i.
Current usage metrics show cumulative count of Article Views (full-text article views including HTML views, PDF and ePub downloads, according to the available data) and Abstracts Views on Vision4Press platform.
Data correspond to usage on the plateform after 2015. The current usage metrics is available 48-96 hours after online publication and is updated daily on week days.
Initial download of the metrics may take a while.