Fig. 6
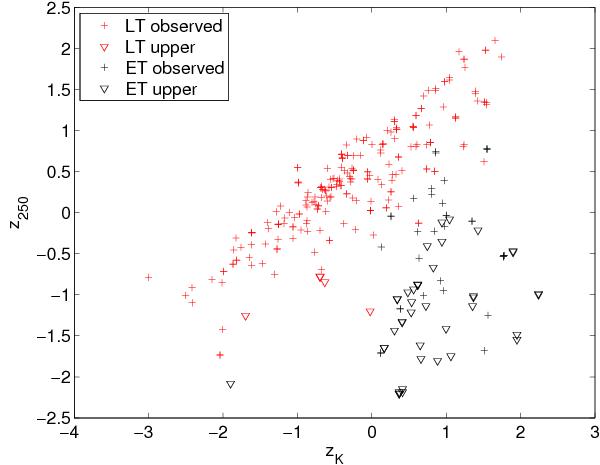
Bivariate Gaussian distribution of the Gaussianised HRS data: K-band versus 250 μm data. Red symbols correspond to late-type galaxies, black ones to early-type. Upper limits are identified as downward triangles. Here, z = G-1(u) with G-1(u) the inverse function of the standard Gaussian CDF, and u is the uniform random variable from the CDF of the LF at the given frequency (see text).
Current usage metrics show cumulative count of Article Views (full-text article views including HTML views, PDF and ePub downloads, according to the available data) and Abstracts Views on Vision4Press platform.
Data correspond to usage on the plateform after 2015. The current usage metrics is available 48-96 hours after online publication and is updated daily on week days.
Initial download of the metrics may take a while.