Fig. 3
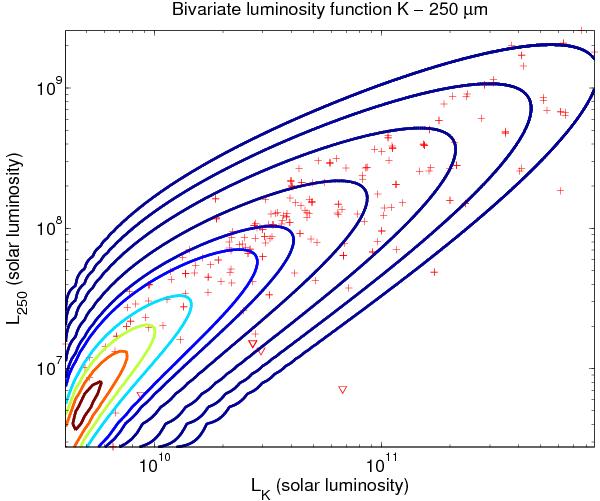
Estimated bivariate PDF shown on logarithmic scale for the K band with the 250 μm-band, for only late-type galaxies. Crosses correspond to the detected fluxes, while downward-pointing triangles to upper limits. Contour lines correspond to the levels 0.00001, 0.0001, 0.001, 0.01, 0.05, 0.1, 0.3, 0.5, 0.7, 0.9. These values correspond to the fraction of the peak value of the BLF that is set to one. The figure clearly shows the correlation among the data.
Current usage metrics show cumulative count of Article Views (full-text article views including HTML views, PDF and ePub downloads, according to the available data) and Abstracts Views on Vision4Press platform.
Data correspond to usage on the plateform after 2015. The current usage metrics is available 48-96 hours after online publication and is updated daily on week days.
Initial download of the metrics may take a while.