Fig. 8
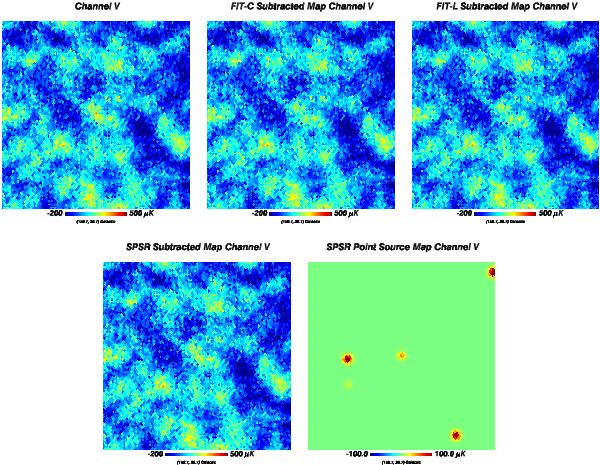
Projected region in channel V of the WMAP 9-year data showing the largest discrepancy between SPSR and FIT-C or FIT-L estimated fluxes for two fitted sources. Images correspond to the WMAP data, the point-source-subtracted data with FIT-C, FIT-L, and SPSR approaches, and point-source-estimated data using SPSR. The differences here between the approaches are a fraction of noise and the diffuse component levels.
Current usage metrics show cumulative count of Article Views (full-text article views including HTML views, PDF and ePub downloads, according to the available data) and Abstracts Views on Vision4Press platform.
Data correspond to usage on the plateform after 2015. The current usage metrics is available 48-96 hours after online publication and is updated daily on week days.
Initial download of the metrics may take a while.