Fig. 5
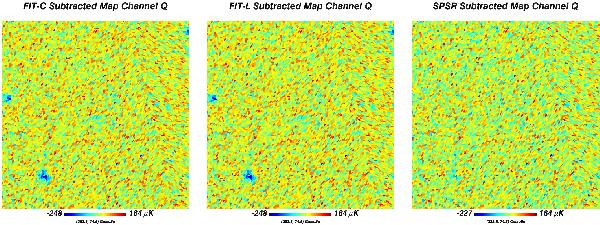
Point-source residuals with noise for the various approaches in a projected region of channel Q, illustrating the lower bias obtained for this channel with the proposed approach. These maps were obtained by subtracting the diffuse component from the point-source-subtracted map. In the first two maps, three negative regions can be visually detected because of the overfitting of the point-source flux in the FIT-C and FIT-L approaches, which is different from the SPSR residual map. This does not display biases that are significantly higher than the noise level.
Current usage metrics show cumulative count of Article Views (full-text article views including HTML views, PDF and ePub downloads, according to the available data) and Abstracts Views on Vision4Press platform.
Data correspond to usage on the plateform after 2015. The current usage metrics is available 48-96 hours after online publication and is updated daily on week days.
Initial download of the metrics may take a while.