Fig. 5
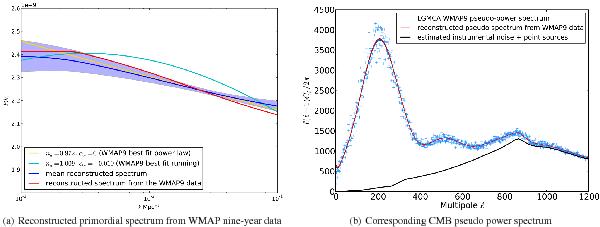
Reconstruction of the primordial power spectrum from the LGMCA WMAP nine-year data and its corresponding pseudo spectrum shown in red. For comparison, we also show the mean of the reconstruction for ns = 0.972 and αs = 0 with a solid dark blue line with the 1σ interval around the mean shown as a shaded blue region. The WMAP nine-year fiducial primordial power spectrum with ns = 0.972 and αs = 0 is shown in yellow and in cyan we show the best-fit primordial power spectrum with a running from WMAP nine-year data with ns = 1.009 and αs = − 0.019. In panel b), we plot the LGMCA WMAP nine-year pseudo power spectrum (blue crosses) and the estimated instrumental noise power spectrum including the point sources power spectrum is shown (solid black line). The very small blue region corresponds to the 1σ interval around the mean reconstructed spectrum (i.e. blue region in panel a)). As can be seen, we do not detect a significant deviation of the WMAP nine-year data from the best fit near scale-invariant spectrum.


Current usage metrics show cumulative count of Article Views (full-text article views including HTML views, PDF and ePub downloads, according to the available data) and Abstracts Views on Vision4Press platform.
Data correspond to usage on the plateform after 2015. The current usage metrics is available 48-96 hours after online publication and is updated daily on week days.
Initial download of the metrics may take a while.