Fig. 2
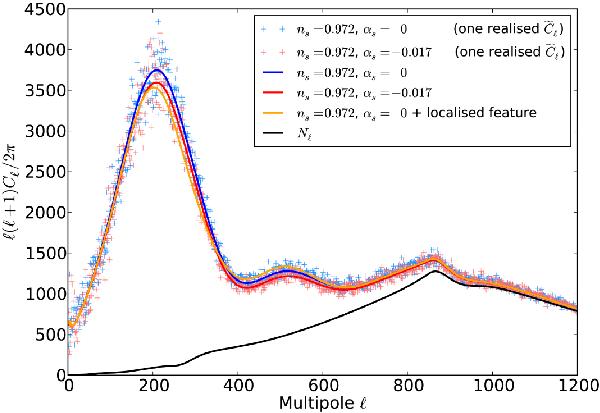
CMB pseudo power spectra for the three types of primordial power spectra. The solid blue line shows the pseudo spectrum based on a primordial spectrum with ns = 0.972 and αs = 0. The light blue crosses show one simulation of this spectrum, computed from the map in Fig. 1. The red line shows the pseudo spectrum for a primordial spectrum with ns = 0.972 and αs = − 0.017 and the orange line corresponds to a power spectrum with a localised feature at k = 0.03 Mpc-1. These spectra include the effects of the mask, the 15 arcmin beam, the HEALPix window for nside of 1024, and the instrumental noise power spectrum, which is shown by a solid black line.
Current usage metrics show cumulative count of Article Views (full-text article views including HTML views, PDF and ePub downloads, according to the available data) and Abstracts Views on Vision4Press platform.
Data correspond to usage on the plateform after 2015. The current usage metrics is available 48-96 hours after online publication and is updated daily on week days.
Initial download of the metrics may take a while.