Fig. 8
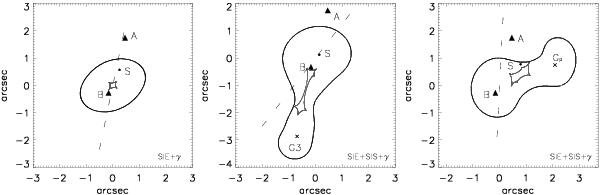
Critical curves (black) and caustics (grey) for the lens models presented in Tables 6 and 7 (right: Model 1, middle: Model 2, left: Model 3). The positions of quasar images A and B are shown by triangles. The source position is marked by a circle. Dashed lines depict the orientation of the external shear. Crosses indicate the positions of the perturbers.
Current usage metrics show cumulative count of Article Views (full-text article views including HTML views, PDF and ePub downloads, according to the available data) and Abstracts Views on Vision4Press platform.
Data correspond to usage on the plateform after 2015. The current usage metrics is available 48-96 hours after online publication and is updated daily on week days.
Initial download of the metrics may take a while.