Fig. 8
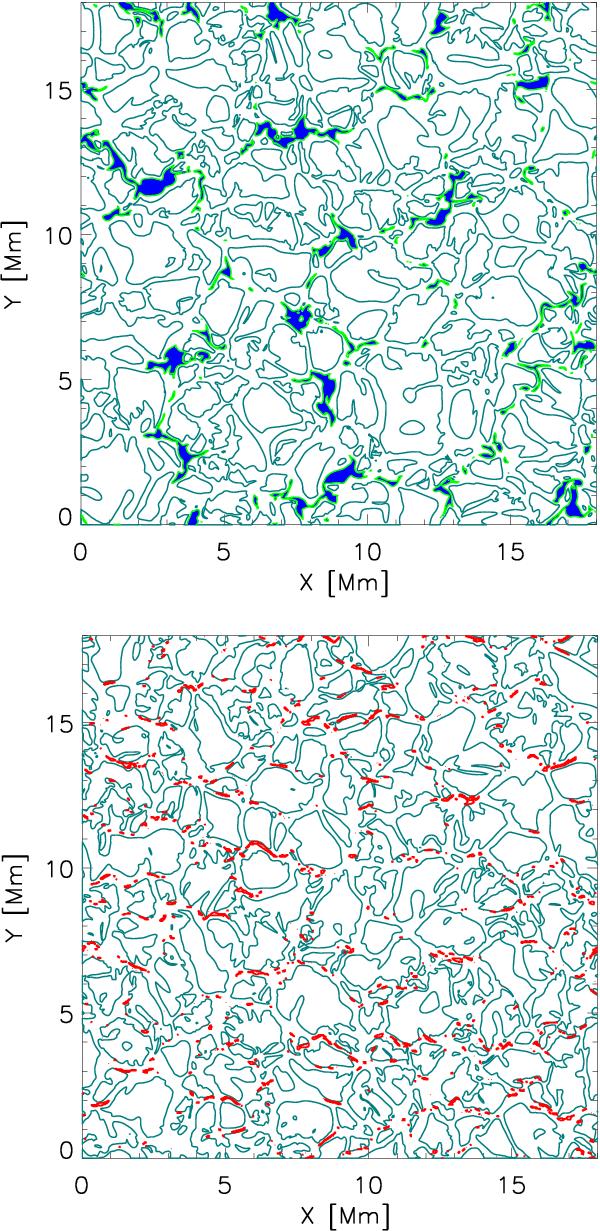
Magnetic and stagnation point selection. The gray contours (at vz = 0) enclose the upflows. Top panel: snapshot from the 100 G simulation. Green contours are at a vertical field strength of 1 kG, the blue contours enclose the centering pixels of our magnetic structures. Bottom panel: a snapshot from the nonmagnetic simulation. Pixels (red) show the regions of flow convergence used as reference (− 1 / div vh< 26 s).
Current usage metrics show cumulative count of Article Views (full-text article views including HTML views, PDF and ePub downloads, according to the available data) and Abstracts Views on Vision4Press platform.
Data correspond to usage on the plateform after 2015. The current usage metrics is available 48-96 hours after online publication and is updated daily on week days.
Initial download of the metrics may take a while.