Free Access
Fig. 3
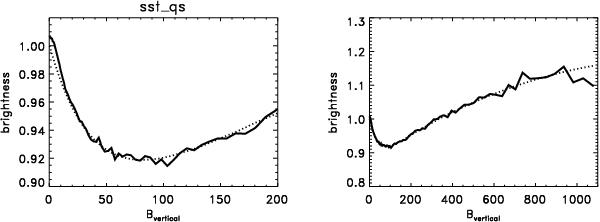
Right panel, solid line: brightness as a function of flux density in a quiet region observed at 630 nm with the SST. Dotted: model fit as described in Schnerr & Spruit 2011. Left panel: same data on an expanded scale.
Current usage metrics show cumulative count of Article Views (full-text article views including HTML views, PDF and ePub downloads, according to the available data) and Abstracts Views on Vision4Press platform.
Data correspond to usage on the plateform after 2015. The current usage metrics is available 48-96 hours after online publication and is updated daily on week days.
Initial download of the metrics may take a while.